The Data Buffet® platform enables clients to view, manipulate and automate delivery of data in a variety of formats. The platform is provided to clients with an economic data subscription from Moody's Analytics.
Data Buffet® provides an easy-to-use web-based interface to assemble data and information in seconds. Users can find and filter datasets by geography, release and source. Data can then be assembled into "baskets" that can be scheduled for delivery by email, ftp, Amazon S3, or ingested directly via API or Microsoft Office applications through our Power Tools Add-In. All data and releases are fully documented and easily accessible from within the platform. Direct access to data and customer service via email, phone, and live chat. Key features:
Create baskets of data from your searches that can be saved and delivered automatically by time (daily, weekly, monthly, quarterly) or when data are updated. You can also:
Moody's Analytics Data Buffet application program interface enables you to retrieve our economic, demographic and financial time series directly into your workflow application or model programmatically. You can use C#, Java, Python and R to write your queries, independent of your platform or operating system. Code samples are provided on GitHub to write queries that retrieve individual series or baskets of data.
The Data Buffet® platform lets you chart economic data series. Each chart can be highly formatted and saved and/or downloaded (offers the same robust formatting options found in Excel).
Create thematic maps of economic and financial data for geographies including European countries/jurisdictions and subdivisions, U.S. states, metropolitan areas, counties, ZIP codes, and other geographic areas around the globe.
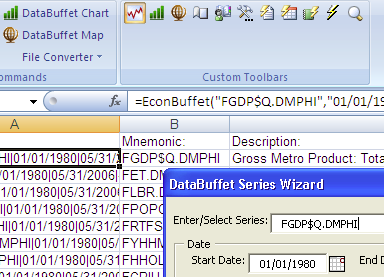
Moody's Analytics Power Tools is an Add-in for Microsoft Office, that enables you to use data and graphics from Data Buffet directly within Excel, Power Point and Word documents. The Add-In retains a link to your Data Buffet subscription, so that data and graphics can be updated with one click or automatically based on different criteria.

Moody's Analytics Data Services team frequently posts helpful articles on the Data Buffet® solution's blog. Posts include explanatory articles on data changes, source delays, FAQs and new data, as well as tips on using DataBuffet.com.
Whether you have a question about a dataset, the software or your account, our specialists stand ready to assist during business hours via email, instant message or telephone.